
Google Sheets adds stock charts and keeps them when importing Excel files
By Automate Basics, written with AI from Google's original
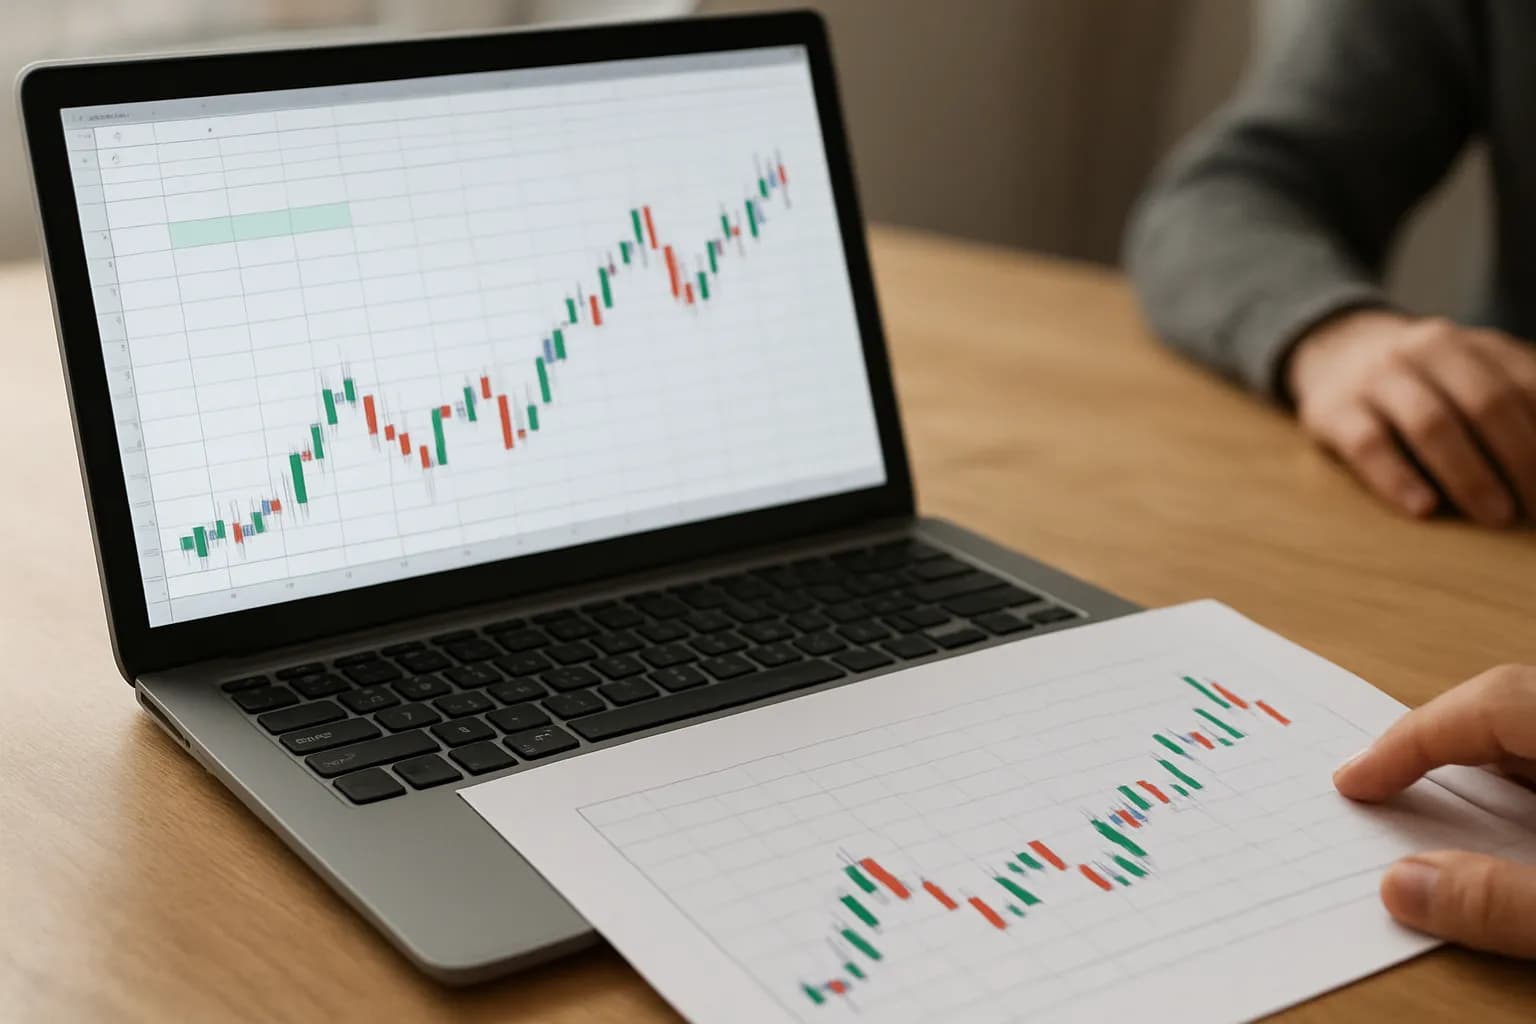
Google has added stock charts to Sheets for people who track market prices. Sheets can also retain these charts when importing Excel files, removing the need to recreate them after a move.
What changed in Google Sheets
Google says Sheets now lets users create and customize two kinds of stock chart: High-Low-Close (HLC) and Open-High-Low-Close (OHLC). Each shows several prices for a period in one marker, rather than requiring separate lines for each price.
An HLC chart shows the highest, lowest and closing prices. An OHLC chart also shows the opening price, making it possible to see whether the period ended above or below where it began. Google says Sheets now carries these chart types over when an Excel file is imported. Previously, Sheets omitted stock charts from imported files, leaving users to make them again.
Who can use the new stock charts?
Google says the charts are available to all Google Workspace customers and people with personal Google accounts. The company identifies financial analysts tracking equities or commodities and working with historical prices as likely users. There is no admin control for the feature.
The rollout begins October 5, 2026, for Rapid Release domains and October 22, 2026, for Scheduled Release domains. Google says each rollout is gradual and may take up to 15 days to become visible. The announcement does not give a separate price for stock charts. If the option is not visible yet, the rollout schedule may explain why.
How do I try stock charts at work?
A useful first task is charting historical prices you already track in Sheets. Choose HLC when the trading range and closing price are enough for your report. Choose OHLC when the opening price also matters, such as when comparing how each period began and ended. Google directs users to its Help Center for guidance on adding and editing charts.
If your team exchanges spreadsheets with Excel users, try importing a file that already contains an HLC or OHLC chart. Check that the chart is still present and that its markers reflect the prices in the source data. A visible chart is useful, but it is worth checking the result before using it in a report.
Frequently asked questions
What is the difference between HLC and OHLC charts in Sheets?
Google says an HLC chart shows each period’s highest, lowest and closing prices. An OHLC chart adds the opening price. That extra point lets you see whether a period closed above or below its opening price without comparing separate lines.
Will stock charts remain in Excel files imported into Sheets?
Google says Sheets now retains HLC and OHLC stock charts when importing Excel files. Previously, those charts were left out, so users had to recreate them. Check an imported chart against its source data before relying on it in a report.
When will Google Sheets stock charts be available?
Google says the gradual rollout starts October 5, 2026, for Rapid Release domains and October 22, 2026, for Scheduled Release domains. Each rollout may take up to 15 days. The feature is available to Google Workspace customers and users with personal Google accounts.
Related reading
 Google to limit free Gemini users to Flash Lite on October 9Google will limit free Gemini users to Flash Lite starting October 9, according to The Verge. People who use Flash or Pro for work will need a paid plan to keep access to those models.
 Pinterest adds AI beauty guides for salon visitsPinterest’s new Beauty Guides use AI to turn hair and nail Pins into salon terminology and planning details. Clients can bring the guides to appointments, while salon professionals can use them as a starting point for discussing a look.
 Mistral releases Large 4 with access limited during safety testingMistral AI has released Large 4, a multimodal model that is currently accessible through a guarded endpoint. The company plans to make its model weights available after safety testing, a distinction for teams weighing how much control they need.
Written with AI from Google's original and published after automatic checks: every figure here appears in the original, and no sentence is copied from it. The picture is AI-generated. The original is the authority.
Source: Use stock charts in Sheets to better visualize price movements, Google, 5 Oct 2026.