
Make an Interactive Chart From Spreadsheet Data in ChatGPT
By Anu Verma

To make an interactive chart from spreadsheet data in ChatGPT, upload a CSV or Excel file, identify the columns and rows to use, and ask for an interactive chart if your interface supports one. Check the plotted data against the spreadsheet before sharing it.
To make an interactive chart from spreadsheet data in ChatGPT, upload a CSV or Excel file, identify the columns and rows to use, and ask for an interactive chart if your interface supports one. Check the plotted data against the spreadsheet before sharing it.
A small sales table makes chart errors easier to catch
A monthly sales chart needs a month column and a sales amount column, with each row representing the same kind of period. Imagine a small sheet with rows for January, February and March. The sheet may also have a Total row at the bottom. Chart the monthly rows, not the Total row, or the final point will look like an unusually strong month.
Give the columns clear headers such as Month and Sales. Keep sales amounts as numbers rather than mixing amounts and notes in the same cells. If the file covers more than one year, include a year column or use full dates so that separate Januaries cannot be combined by mistake. A date column is especially helpful when month names need to appear in calendar order.
Check what each amount represents before uploading. A Sales column might contain monthly revenue, individual transactions or sales for separate products. Those require different charts and sometimes require adding rows together first. If you want one point per month, either provide monthly totals or tell ChatGPT which transaction rows to group. Keep a blank sales cell blank when its value is unknown; do not enter zero just to make the table look complete.
A CSV or Excel upload needs a precise chart request
Upload the CSV or Excel file to ChatGPT and tell it exactly which data should appear in the chart. OpenAI describes file uploads and data analysis as ways to work with tables and create charts, but the controls available to you can vary by interface. Check the attachment option where you use ChatGPT if you cannot see a way to add your file.
For the small sales example, a useful request is: “Use the Month and Sales columns from the monthly sales table. Exclude the Total row. Put months in calendar order, keep missing sales amounts missing, and make an interactive line chart if available. Show the rows and values used for the chart.” If an Excel workbook has several sheets, name the sheet that contains the monthly table. If a CSV contains other columns, say which ones matter.
Ask ChatGPT to state whether it used the sales amounts directly or added rows together. That answer helps you spot an unwanted calculation before you rely on the picture. You can read more about the tool’s general capabilities on the ChatGPT tool page, but the request itself does not require code or a separate charting service.
An interactive chart is useful only when its controls work
Ask ChatGPT for an interactive chart, then check whether the result actually lets you inspect the data. Depending on the chart and the ChatGPT interface, a result may offer controls such as hovering over points. A picture that looks polished but cannot be inspected is a static chart, even if the request used the word “interactive.”
Move over a month in the chart if that control is available. Check that the displayed month and sales amount match the source row. If ChatGPT provides a table behind the chart, compare that table too. Ask it to identify the source rows for an unexpected point rather than accepting an explanation based only on the chart’s appearance.
A static chart is enough when you need to show a simple trend and readers do not need to inspect individual values. You can also make a chart in Excel or your spreadsheet app when you need a familiar chart editor or expect to update the same file regularly. If the real task is moving data between apps whenever new sales arrive, compare automation with a one-off ChatGPT task before building a workflow.
Dates, totals and blanks need separate checks
Check the chart’s month order, included rows and missing values against the spreadsheet before using it. These are different errors, and a chart can look reasonable while containing any of them.
For dates, confirm that January, February and March appear in calendar order, not alphabetical order. If the source has dates covering more than one year, inspect the plotted labels to make sure months from different years remain separate. Ask ChatGPT to show the dates it read from the file if a point appears under the wrong month.
For totals, look for a Total row or subtotal in the plotted data. A total describes other rows; it is not another month. If the sales sheet contains transaction rows as well as a monthly summary, choose one level of detail so the same sales are not counted twice.
For blanks, compare an empty March sales cell with what the chart shows. Missing means the amount is unknown; zero says a known amount is zero. Ask ChatGPT not to fill, estimate or silently drop missing values, and to explain how the chart displays them. The same habit applies to other spreadsheet work, including AI expense categorization in a spreadsheet: inspect the source rows, not just the finished output.
The plotted table is the quickest way to verify the result
Ask ChatGPT to display the exact table it used to make the chart, including any grouping or filtering it applied. A visual check can reveal an obvious spike, but the plotted table reveals whether ChatGPT selected the wrong column, treated a Total row as a month or changed a blank into zero.
Compare the displayed rows with the original sales sheet. Start with the month labels, then check the sales amounts beside them. If your source contains transaction rows, ask for the calculation behind each monthly point and compare it with a total calculated in the spreadsheet. If the two disagree, find the excluded or duplicated rows before asking for a prettier chart.
Keep the corrected instruction with the file if you will repeat the task. For example, specify the sheet, the month and sales columns, whether transaction rows must be grouped, the Total row to exclude and the treatment of blanks. A clearer instruction reduces ambiguity, but it does not replace checking. For a broader way to inspect AI output before relying on it, see how to fact-check ChatGPT answers.
A checked chart is ready to share in the right format
Share the chart only after deciding whether its recipient needs to inspect values or simply see the trend. If interactivity matters, check what the available sharing or export option preserves. A downloaded image can show the chart without preserving hover controls or access to the underlying data. When inspection matters, share an appropriate chart view or the checked spreadsheet alongside the image, subject to your workplace’s sharing rules.
Before uploading workplace sales data, check whether the file contains customer names, personal information or details unrelated to the chart. Remove columns the chart does not need, and follow your organisation’s rules for using AI tools. A small monthly summary may be sufficient; individual transaction records are not necessary if the monthly amounts are already available and trustworthy.
If the chart is for a recurring report, save the source file and the instructions you gave ChatGPT. Recheck new months rather than assuming that last month’s correct chart makes the next one correct. New rows, a renamed column or an added subtotal can change what gets plotted. The goal is a chart whose dates, amounts and gaps you can trace back to the spreadsheet.
Sources consulted
- OpenAI Help Center (help.openai.com)
- Microsoft Support (support.microsoft.com)
Frequently asked questions
Can I upload a CSV to ChatGPT and make a chart?
Yes. Attach the CSV where file uploads are available, then name the columns to use and describe the chart you want. Ask ChatGPT to show the rows behind the chart. Check that it read dates as dates, excluded summary rows and did not treat blank amounts as zero.
Can ChatGPT create a chart from Excel data?
ChatGPT can work with an uploaded Excel file when file uploads and data analysis are available in your interface. Name the worksheet and columns, especially if the workbook has several tables. Ask to see the plotted data before using the chart, since selecting the wrong sheet can still produce a plausible result.
Why did ChatGPT put my months in the wrong order?
Month names may have been treated as text rather than calendar dates. Ask ChatGPT to order the months chronologically and show the date values it used. If the file covers more than one year, supply full dates or a separate year column so matching month names remain distinct.
What if ChatGPT gives me a static chart instead of an interactive one?
Ask explicitly for an interactive chart and check whether the result offers controls for inspecting points. Availability can depend on the chart and interface. If the result remains static, use it for a simple visual summary or make the chart in your spreadsheet app when readers need dependable interaction.
Related guides
 How to Find Common Themes in Survey Responses With AIGroup survey comments into themes, keep representative quotes, and check each AI finding against the original responses.
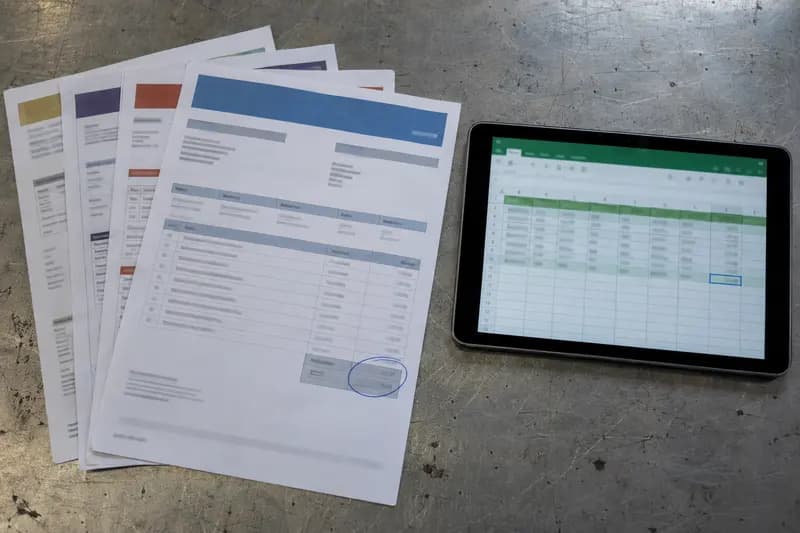 Extract PDF Invoice Data Into a Spreadsheet Automatically (No Typing)One invoice: paste the PDF into ChatGPT or Claude. Every week: an n8n, Make or Power Automate flow fills Excel or Sheets. Then check totals and tax.
 Combine Monthly Excel Files From a Folder With Power QueryUse Power Query to append monthly Excel files into a refreshable table, check changed headers, and keep backup copies out of the import.
Drafted with AI assistance and checked automatically before publishing. Tools and prices change; check the official source before you act.